Tag Archives: #CommercialRealEstateBrokerTampaFlorida

TMC-The Mahr Company Receives 2016 Best of Tampa Bay Award
TMC-The Mahr Company Receives 2016 Best of Tampa Bay Award
Tampa Bay Award Program Honors the Achievement
TAMPA BAY, FLORIDA March 9, 2016 — TMC-The Mahr Company has been selected for the 2016 Best of Tampa Bay Award in the Tenant/User Representation Services category by the Tampa Bay Award Program.
Each year, the Tampa Bay Award Program identifies companies that we believe have achieved exceptional marketing success in their local community and business category. These are local companies that enhance the positive image of small business through service to their customers and our community. These exceptional companies help make the Tampa Bay area a great place to live, work and play.
Various sources of information were gathered and analyzed to choose the winners in each category. The 2016 Tampa Bay Award Program focuses on quality, not quantity. Winners are determined based on the information gathered both internally by the Tampa Bay Award Program and data provided by third parties.
About Tampa Bay Award Program
The Tampa Bay Award Program is an annual awards program honoring the achievements and accomplishments of local businesses throughout the Tampa Bay area. Recognition is given to those companies that have shown the ability to use their best practices and implemented programs to generate competitive advantages and long-term value.
The Tampa Bay Award Program was established to recognize the best of local businesses in our community. Our organization works exclusively with local business owners, trade groups, professional associations and other business advertising and marketing groups. Our mission is to recognize the small business community’s contributions to the U.S. economy.
Did You Know | Your Glass is Half Fillable…………..
 We recently heard the statement | The glass is half fillable | This resonates with us at TMC – The Mahr Company
The statement doesn’t declare the glass as being either half full or half empty | Rather it implies to us that any commercial real estate situation can be further enhanced or improved through | persistent | planned | execution and dedicated action |
TMC- The Mahr Company | our greatest accomplishment is not behind us| it is yet to be| Your goals and commercial real estate needs | whatever they may be | wherever they make take us |whatever they may require | is our commitment to you.
TMC | Evaluation | Engagement | Execution | Equates to Excellence
TMC | Evaluation | Engagement | Execution | Equates to Excellence

“Anyone who’s ever consistently won championships at a high level will tell you that its the groundwork of developing your weaknesses that will get you to the top and keep you there, even more than relying on what you feel you all ready do well. At the top-tier levels, everyone is faster, stronger and more powerful. The champion, the dynasty is the one that chips off a bit more inefficiencies, smooths out the rough edges, gets a little less injured throughout the course and recovers a bit better before the next battle. Train Smarter…” Raphael Ruiz | Axis
TMC- The Mahr Company | Your goals | Your commercial real estate needs | Whatever they may be | Wherever they make take us | Whatever they may require | Is our commitment to you.
TMC: The Courage and Conviction to take Focused Action = RESULTS……
“In whatever areas of life or endeavor, one may meet the challenges of courage. Whatever may be the sacrifices, if one follows his/her conscious; the loss of friends, his/her fortune, his/her commitment, even the esteem of fellow men….Each person must decide for him/herself the course he/she will follow. The studies of past can define that ingredient, they can teach, they can offer hope, they can provide inspiration, but they cannot supply courage itself. For this, each person must look into their soul and take action thereon.” JFK
paraphrased by fsm from a quote by Caroline Kennedy, his daughter, in her book, “Profiles In Courage For Our Times.”

TMC-The Mahr Company: Connecting the Dots
TMC-The Mahr Company We Connect the Dots………..Lots of them in our service to you
TMC-The Mahr Company offering the highest level of professional service with attention to detail
 Your goals and commercial real estate needs, whatever they may be, wherever they make take us and whatever they may require are our commitment to you.
Understanding Cash on Cash Return in Commercial Real Estate
By: Robert Schmidt
Cash on cash return in commercial real estate is important when you are evaluating investment real estate transactions. What is the cash on cash return and how do you calculate it for a commercial property? What are the limitations of using this method? In this article we’ll tackle these questions and also provide some detailed examples of the cash on cash return.
Cash on Cash Return Formula
Before diving into some cash on cash return examples, it is important to have a sound understanding of exactly what the term means. So, let’s start with the basics. First, here’s the cash on cash return formula:
![]()
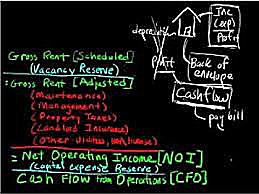
As shown in the cash on cash formula above, the cash on cash return is a simple measure of investment performance that is calculated as cash flow before taxes divided by the initial equity investment. The cash flow before tax figure for each year is calculated on the real estate proforma, and the initial equity investment is simply the total purchase price less any loan proceeds.
Cash on Cash Return Example
Next, let’s take a simple example to illustrate the cash on cash return. Suppose you are evaluating an office building with an estimated Year 1 Cash Flow Before Tax of $60,000. Also, assume that the negotiated purchase price of the property is $1,200,000 and you are able to secure a loan for $900,000 (75% Loan to Value). What’s your cash on cash return for year 1?
![]()
The calculation itself is pretty simple – your cash on cash return for year 1 would be the Year 1 cash flow divided by your total cash out of pocket, which equals 20%. So what does this simple measure of investment performance tell you? Using only the figures above, the cash on cash return tells you that your year 1 return on investment is 20%. This of course assumes that your initial equity investment figure and also your cash flow projection is correct.
Cash on Cash Return Limitations
The cash on cash return is a simple measure of investment performance that is quick and easy. It can be a good starting point for quickly filtering out potential investment properties. But don’t be fooled by the many limitations of the cash on cash return.
Consider the following series of cash flows:

The year 1 cash on cash return in the levered example above shows a 3% cash on cash return. To find this simply take the end of year (EOY) 1 cash flow of $15,805 and divide it by the initial equity investment of $515,000.
But as you can see in the table above, the internal rate of return (IRR) is 10.71%. This suggests that according to a discounted cash flow analysis, the investment is actually much better (almost 4x better) than what’s indicated by the cash on cash return. If you were only using the cash on cash return as an investment filter, then you’d pass up this opportunity to earn nearly 11%.
The reason why the cash on cash return is so much lower than the IRR in the example above is because the cash on cash return ignores the other 9 years of operating cash flows in the holding period. Plus, it also ignores the reversion cash flow at the end of year 10 that comes from the sale of the asset. Without taking into account these additional cash flows that occur over the holding period, it’s impossible for the cash on cash return to accurately reflect the return characteristics of the property.
The same is true when looking at the unlevered example above. The cash on cash return in the unlevered series of cash flows above is 6.2% ($95,000 divided by $1,515,000), and the IRR is 7.51%. This series of cash flows doesn’t produce as big of a gap as in the levered example, but it’s still a difference. Without taking into account all cash flows over the holding period, the gap between the cash on cash return and the IRR will be unknown.
As a side note – keep in mind that this can work in reverse too. In the above examples the IRR was higher than the cash on cash return because operating cash flows grow over the holding period and the sales proceeds of the asset are favorable. But it could also be the case that many leases will expire a few years after acquisition, causing operating cash flow to decline and the final reversion cash flow to be lower. This could produce the opposite result where the cash on cash return ends up being more favorable than the IRR.
Discounted Cash Flow Analysis
As shown in the example above, a discounted cash flow analysis provides a much more complete return profile of an investment property. Sure, simple measures of investment performance like the cash on cash return work as a starting point in your evaluation. But as your interest in a property becomes more serious, so should your analysis.
A discounted cash flow analysis uses concepts of the time value of money to value a commercial real estate asset. When looking at a time period extending out over a number of years, a DCF analysis estimates future cash flows and discounts cash flows back to the present. Using the discounted cash flow analysis will require forecasting future cash flows (incoming and outgoing), determining the necessary total return, and then discounting the forecasted cash flows back to the present at the necessary rate of return.
Sourced By: Property Metrics
We Are Dedicated To Serving YOU
We are dedicated to serving you. To being the best we can be in your service and in the accomplishment of your goals. As such we embrace this approach to being a more efficient, productive and entrepreneurial business to best serve you.
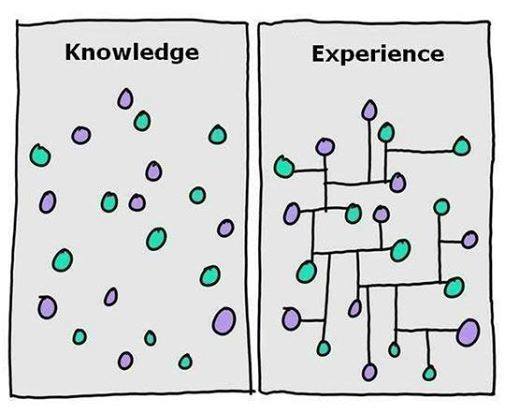
The below was created by: Anna Vital infographic author http://anna.vc/

TMC-The Mahr Company EXCELLENCE IN THE DETAILS:
Selectively working with clients and prospective clients, while building lifelong working relationships.
Our Services solve your problems, saving you time and money.
The TMC team offers focused and skilled professional services, tailored to achieve your goals
Difference Between Cap Rate and Discount Rate
Difference Between Cap Rate and Discount Rate
By propertymetrics
What is the difference between a cap rate and a discount rate? Because these concepts are often confused, this article will discuss the difference between a capitalization rate and a discount rate in commercial real estate, and leave you with a clear understanding of the two concepts.
First, let’s go over a couple of definitions, and then we’ll dive into a specific example.
Cap Rate
The capitalization rate, often just called the cap rate, is the ratio of Net Operating Income (NOI) to property asset value. So, for example, if a property was listed for $1,000,000 and generated an NOI of $100,000, then the cap rate would be $100,000/$1,000,000, or 10%.
What is a cap rate in commercial real estate useful for? Because individual properties differ greatly in size and magnitude, it’s helpful to talk about property prices and values in a common language. Thinking of property value per dollar of current net income achieves this objective.
The cap rate is simply a measure that quantifies property value per dollar of current net income. Another way to think about the cap rate is that it’s the inverse of the popular price/earnings multiple used in the stock markets.
Discount Rate
The discount rate is the rate used in a discounted cash flow analysis to compute present values.
When solving for the future value of money set aside today, we compound our investment at a particular rate of interest. When solving for the present value, the problem is one of discounting, rather than growing, and the required expected return acts as the discount rate. In other words, discounting is merely the inverse of growing.
What is the discount rate used for in commercial real estate analysis? In commercial real estate the discount rate is used in a discounted cash flow analysis to compute a net present value. Typically, the investor’s required rate of return is used as a discount rate, or in the case of an institutional investor, the weighted average cost of capital. This ensures that the initial investment made in a property achieves the investor’s return objectives, given the projected cash flows of the property. The intuition behind IRR and NPV is that it allows us to determine how much an investor should pay for a property, given his required rate of return, or discount rate.
Cap Rate vs Discount Rate
So, back to the original question – what’s the difference between the cap rate versus the discount rate? The cap rate allows us to value a property based on a single year’s NOI. So, if a property had an NOI of $80,000 and we thought it should trade at an 8% cap rate, then we could estimate its value at $1,000,000.
The discount rate, on the other hand, is the investor’s required rate of return. The discount rate is used to discount future cash flows back to the present to determine value and account’s for all years in the holding period, not just a single year like the cap rate.
If a property’s cash flows are expected to increase or decrease over the holding period, then the cap rate will be a misleading performance indicator. Consider the following two investment alternatives:
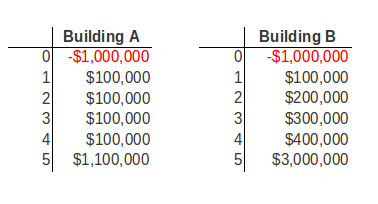
Both properties have a cap rate of 10% based on the NOI in year 1. But clearly the cash flows are better for Building B and it therefore provides a higher rate of return. The exact rate of return can be quantified using the Internal Rate of Return (IRR). Also, assuming equal risk, any rational investor should be willing to pay more for Building B because its future cash flows are expected to grow more than Building A’s. But how much more could you pay for Building B while still achieving your required return?
By completing a multiyear discounted cash flow analysis we could quantify exactly how much we can pay for this property with a Net Present Value (NPV), given an investor’s discount rate. The cap rate, on the other hand, will not be able to answer this question for us. In short, while the cap rate and the discount rate may appear similar, they are two different things used for different purposes.
What You Should Know About The Cap Rate
What You Should Know About The Cap Rate
Sourced by Property Metrics
The capitalization rate is a fundamental concept in the commercial real estate industry. Yet, it is often misunderstood and sometimes incorrectly used. This post will take a deep dive into the concept of the cap rate, and also clear up some common misconceptions.
Cap Rate Definition
What is a cap rate? The capitalization rate, often just called the cap rate, is the ratio of Net Operating Income (NOI) to property asset value. So, for example, if a property was listed for $1,000,000 and generated an NOI of $100,000, then the cap rate would be $100,000/$1,000,000, or 10%.
![]()
Cap Rate Example
Let’s take an example of how a cap rate is commonly used. Suppose we are researching the recent sale of a Class A office building with a stabilized Net Operating Income (NOI) of $1,000,000, and a sale price of $17,000,000. In the commercial real estate industry, it is common to say that this property sold at a 5.8% cap rate.
Intuition Behind the Cap Rate
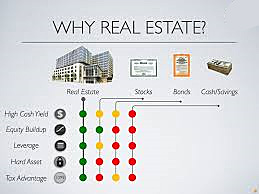
What is the cap rate actually telling you? One way to think about the cap rate intuitively is that it represents the percentage return an investor would receive on an all cash purchase. In the above example, assuming the real estate proforma is accurate, an all cash investment of $17,000,000 would produce an annual return on investment of 5.8%. Another way to think about the cap rate is that it’s just the inverse of the price/earnings multiple. Consider the following chart:

As shown above, cap rates and price/earnings multiples are inversely related. In other words, as the cap rate goes up, the valuation multiple goes down.
When, and When Not, to Use a Cap Rate
The cap rate is a very common and useful ratio in the commercial real estate industry and it can be helpful in several scenarios. For example, it can and often is used to quickly size up an acquisition relative to other potential investment properties. A 5% cap rate acquisition versus a 10% cap rate acquisition for a similar property in a similar location should immediately tell you that one property has a higher risk premium than the other.
Another way cap rates can be helpful is when they form a trend. If you’re looking at cap rate trends over the past few years in a particular sub-market then the trend can give you an indication of where that market is headed. For instance, if cap rates are compressing that means values are being bid up and a market is heating up. Where are values likely to go next year? Looking at historical cap rate data can quickly give you insight into the direction of valuations.
While cap rates are useful for quick back of the envelope calculations, it is important to note when cap rates should not be used. When properly applied to a stabilized Net Operating Income (NOI) projection, the simple cap rate can produce a valuation approximately equal to what could be generated using a more complex discounted cash flow (DCF) analysis. However, if the property’s net operating income stream is complex and irregular, with substantial variations in cash flow, only a full discounted cash flow analysis will yield a credible and reliable valuation.
Components of the Cap Rate
What are the components of the cap rate and how can they be determined? One way to think about the cap rate is that it’s a function of the risk free rate of return plus some risk premium. In finance, the risk free rate is the theoretical rate of return of an investment with no risk of financial loss. Of course in practice all investments carry even a small amount of risk. However, because U.S. bonds are considered to be very safe, the interest rate on a U.S. treasury bond is normally used as the risk-free rate. How can we use this concept to determine cap rates?
Suppose you have $10,000,000 to invest and 10-year treasury bonds are yielding 3% annually. This means you could invest all $10,000,000 into treasuries, considered a very safe investment, and spend your days at the beach collecting checks. What if you were presented with an opportunity to sell your treasuries and instead invest in a Class A office building with multiple tenants? A quick way to evaluate this potential investment property relative to your safe treasury investment is to compare the cap rate to the yield on the treasury bonds.
Suppose the acquisition cap rate on the investment property was 5%. This means that the risk premium over the risk free rate is 2%. This 2% risk premium reflects all of the additional risk you assume over and above the risk free treasuries, which takes into account factors such as:
- Age of the property.
- Credit worthiness of the tenants.
- Diversity of the tenants.
- Length of tenant leases in place.
- Broader supply and demand fundamentals in the market for this particular asset class.
- Underlying economic fundamentals of the region including population growth, employment growth, and inventory of comparable space on the market.
When you take all of these items and break them out, it’s easy to see their relationship to the risk free rate and the overall cap rate. It’s important to note that the actual percentages of each risk factor of a cap rate and ultimately the cap rate itself are subjective and depend on your own business judgement and experience.
Is cashing in your treasuries and investing in an office building at a 5% acquisition cap rate a good decision? This of course depends on how risk averse you are. An extra 2% yield on your investment may or may not be worth the additional risk inherent in the property. Perhaps you are able to secure favorable financing terms and using this leverage you could increase your return from 5% to 8%. If you a more aggressive investor this might be appealing to you. On the other hand, you might want the safety and security that treasuries provide, and a 3% yield is adequate compensation in exchange for this downside protection.
Band of Investment Method
The above risk free rate approach is not the only way to think about cap rates. Another popular alternative approach to calculating the cap rate is to use the band of investment method. This approach takes into account the return to both the lender and the equity investors in a deal. The band of investment formula is simply a weighted average of the return on debt and the required return on equity. For example, suppose we can secure a loan at an 80% Loan to Value (LTV), amortized over 20 years at 6%. This results in a mortgage constant of 0.0859. Further suppose that the required return on equity is 15%. This would result in a weighted average cap rate calculation of 9.87% (80%*8.59% + 20%*15%).
The Gordon Model
One other approach to calculating the cap rate worth mentioning is the Gordon Model. If you expect NOI to grow each year at some constant rate, then the Gordon Model can turn this constantly growing stream of cash flows into a simple cap rate approximation. The Gordon Model is a concept traditionally used in finance to value a stock with dividend growth:

This formula solves for Value, given cash flow (CF), the discount rate (k), and a constant growth rate (g). From the definition of the cap rate we know that Value = NOI/Cap. This means that the cap rate can be broken down into two components, k-g. That is, the cap rate is simply the discount rate minus the growth rate.
How can we use this? Suppose we are looking at a building with an NOI of $100,000 and in our analysis we expect that the NOI will increase by 1% annually. How can we determine the appropriate cap rate to use? Using the Gordon Model, we can simply take our discount rate and subtract out the annual growth rate. If our discount rate (usually the investor’s required rate of return) is 10%, then the appropriate cap rate to use in this example would be 9%, resulting in a valuation of $1,111,111.
The Gordon Model is a useful concept to know when evaluating properties with growing cash flows. However, it’s not a one-size fits all solution and has several built in limitations. For example, what if the growth rate equals the discount rate? This would yield an infinite value, which of course in nonsensical. Alternatively, when the growth rate exceeds the discount rate, then the Gordon Model yields a negative valuation which is also a nonsensical result.
These built-in limitations don’t render the Gordon Model useless, but you do need to be aware of them. Always make sure you understand the assumptions you are making in an analysis and whether they are reasonable or not.
The Many Layers of Valuation
Commercial real estate valuation is a multi-layered process and usually begins with simpler tools than the discounted cash flow analysis. The cap rate is one of these simpler tools that should be in your toolkit. The cap rate can communicate a lot about a property quickly, but can also leave out many important factors in a valuation, most notably the impact of irregular cash flows.
The solution is to create a multi-period cash flow projection that takes into account these changes in cash flow, and ultimately run a discounted cash flow analysis to arrive at a more accurate valuation.
