
The Key To Investing in Commercial Real Estate Is Timing. Ask us how we can assist you in identifying the right strategies for your commercial real estate investments, whether acquisitions or dispositions.
The Key To Investing in Commercial Real Estate Is Timing. Ask us how we can assist you in identifying the right strategies for your commercial real estate investments, whether acquisitions or dispositions.
The capitalization rate is a fundamental concept in the commercial real estate industry. Yet, it is often misunderstood and sometimes incorrectly used. This post will take a deep dive into the concept of the cap rate, and also clear up some common misconceptions.
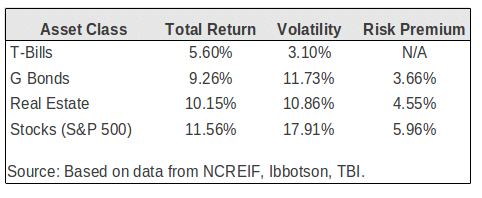
What is a cap rate? The capitalization rate, often just called the cap rate, is the ratio of Net Operating Income (NOI) to property asset value. So, for example, if a property was listed for $1,000,000 and generated an NOI of $100,000, then the cap rate would be $100,000/$1,000,000, or 10%.
![]()
Let’s take an example of how a cap rate is commonly used. Suppose we are researching the recent sale of a Class A office building with a stabilized Net Operating Income (NOI) of $1,000,000, and a sale price of $17,000,000. In the commercial real estate industry, it is common to say that this property sold at a 5.8% cap rate.
What is the cap rate actually telling you? One way to think about the cap rate intuitively is that it represents the percentage return an investor would receive on an all cash purchase. In the above example, assuming the real estate proforma is accurate, an all cash investment of $17,000,000 would produce an annual return on investment of 5.8%. Another way to think about the cap rate is that it’s just the inverse of the price/earnings multiple. Consider the following chart:

As shown above, cap rates and price/earnings multiples are inversely related. In other words, as the cap rate goes up, the valuation multiple goes down.
The cap rate is a very common and useful ratio in the commercial real estate industry and it can be helpful in several scenarios. For example, it can and often is used to quickly size up an acquisition relative to other potential investment properties. A 5% cap rate acquisition versus a 10% cap rate acquisition for a similar property in a similar location should immediately tell you that one property has a higher risk premium than the other.
Another way cap rates can be helpful is when they form a trend. If you’re looking at cap rate trends over the past few years in a particular sub-market then the trend can give you an indication of where that market is headed. For instance, if cap rates are compressing that means values are being bid up and a market is heating up. Where are values likely to go next year? Looking at historical cap rate data can quickly give you insight into the direction of valuations.
While cap rates are useful for quick back of the envelope calculations, it is important to note when cap rates should not be used. When properly applied to a stabilized Net Operating Income (NOI) projection, the simple cap rate can produce a valuation approximately equal to what could be generated using a more complex discounted cash flow (DCF) analysis. However, if the property’s net operating income stream is complex and irregular, with substantial variations in cash flow, only a full discounted cash flow analysis will yield a credible and reliable valuation.
What are the components of the cap rate and how can they be determined? One way to think about the cap rate is that it’s a function of the risk free rate of return plus some risk premium. In finance, the risk free rate is the theoretical rate of return of an investment with no risk of financial loss. Of course in practice all investments carry even a small amount of risk. However, because U.S. bonds are considered to be very safe, the interest rate on a U.S. treasury bond is normally used as the risk-free rate. How can we use this concept to determine cap rates?
Suppose you have $10,000,000 to invest and 10-year treasury bonds are yielding 3% annually. This means you could invest all $10,000,000 into treasuries, considered a very safe investment, and spend your days at the beach collecting checks. What if you were presented with an opportunity to sell your treasuries and instead invest in a Class A office building with multiple tenants? A quick way to evaluate this potential investment property relative to your safe treasury investment is to compare the cap rate to the yield on the treasury bonds.
Suppose the acquisition cap rate on the investment property was 5%. This means that the risk premium over the risk free rate is 2%. This 2% risk premium reflects all of the additional risk you assume over and above the risk free treasuries, which takes into account factors such as:
When you take all of these items and break them out, it’s easy to see their relationship to the risk free rate and the overall cap rate. It’s important to note that the actual percentages of each risk factor of a cap rate and ultimately the cap rate itself are subjective and depend on your own business judgement and experience.
Is cashing in your treasuries and investing in an office building at a 5% acquisition cap rate a good decision? This of course depends on how risk averse you are. An extra 2% yield on your investment may or may not be worth the additional risk inherent in the property. Perhaps you are able to secure favorable financing terms and using this leverage you could increase your return from 5% to 8%. If you a more aggressive investor this might be appealing to you. On the other hand, you might want the safety and security that treasuries provide, and a 3% yield is adequate compensation in exchange for this downside protection.
The above risk free rate approach is not the only way to think about cap rates. Another popular alternative approach to calculating the cap rate is to use the band of investment method. This approach takes into account the return to both the lender and the equity investors in a deal. The band of investment formula is simply a weighted average of the return on debt and the required return on equity. For example, suppose we can secure a loan at an 80% Loan to Value (LTV), amortized over 20 years at 6%. This results in a mortgage constant of 0.0859. Further suppose that the required return on equity is 15%. This would result in a weighted average cap rate calculation of 9.87% (80%*8.59% + 20%*15%).
One other approach to calculating the cap rate worth mentioning is the Gordon Model. If you expect NOI to grow each year at some constant rate, then the Gordon Model can turn this constantly growing stream of cash flows into a simple cap rate approximation. The Gordon Model is a concept traditionally used in finance to value a stock with dividend growth:

This formula solves for Value, given cash flow (CF), the discount rate (k), and a constant growth rate (g). From the definition of the cap rate we know that Value = NOI/Cap. This means that the cap rate can be broken down into two components, k-g. That is, the cap rate is simply the discount rate minus the growth rate.
How can we use this? Suppose we are looking at a building with an NOI of $100,000 and in our analysis we expect that the NOI will increase by 1% annually. How can we determine the appropriate cap rate to use? Using the Gordon Model, we can simply take our discount rate and subtract out the annual growth rate. If our discount rate (usually the investor’s required rate of return) is 10%, then the appropriate cap rate to use in this example would be 9%, resulting in a valuation of $1,111,111.
The Gordon Model is a useful concept to know when evaluating properties with growing cash flows. However, it’s not a one-size fits all solution and has several built in limitations. For example, what if the growth rate equals the discount rate? This would yield an infinite value, which of course in nonsensical. Alternatively, when the growth rate exceeds the discount rate, then the Gordon Model yields a negative valuation which is also a nonsensical result.
These built-in limitations don’t render the Gordon Model useless, but you do need to be aware of them. Always make sure you understand the assumptions you are making in an analysis and whether they are reasonable or not.
Commercial real estate valuation is a multi-layered process and usually begins with simpler tools than the discounted cash flow analysis. The cap rate is one of these simpler tools that should be in your toolkit. The cap rate can communicate a lot about a property quickly, but can also leave out many important factors in a valuation, most notably the impact of irregular cash flows.
The solution is to create a multi-period cash flow projection that takes into account these changes in cash flow, and ultimately run a discounted cash flow analysis to arrive at a more accurate valuation.
If you want to live a personal and professional life with no regrets, follow these 43 life lessons, penned by H. Jackson Brown.
In the Fall of 1990, Mr. Brown sat at his kitchen table, pulled out a pad of paper and began writing advice to his son, who had just entered college. Mr. Brown’s aphorisms eventually evolve into twenty one books, including four New York Times bestsellers. With Life’s Little Instruction Book, Mr. Brown became the first author to simultaneously hold the number one positions on both of the NYT’s hardback and paperback lists.
Some of Mr. Brown’s quotes have become so well known that they are often mis-attributed to historical figures, including the following, which is widely credited to Mark Twain: “Twenty years from now you will be more disappointed by the things you didn’t do than by the ones you did do. So throw off the bowlines. Sail away from the safe harbor. Catch the trade winds in your sails. Explore. Dream. Discover.”
I came across a special edition of Mr. Brown’s Life’s Little Instruction Book (Volumes I – III) while waiting in line at a FedEx store. I almost never make impulse purchases, but after flipping through a few pages, the following paraphrased quote jumped off the page: “Live your life so that your epitaph boldly states, ‘No regrets.’” I promptly purchased the book as a Christmas gift for my teenage son.
As James Clear notes in The #1 Regret Of Dying Patients, far too many people spend their final stage of life regretting their youthful choices. Mr. Brown’s advice will help you to, “live a good, honorable life which you can enjoy a second time when you are old.”
When read nearly twenty-five years after they were penned, some of Mr. Brown’s musing are anachronisms (e.g., “Don’t sit while ladies are standing”), while others are banal (“Turn off the tap when brushing your teeth”). However, the vast majority of the 1,560 quotations in Volumes I – III of Life’s Little Instruction Book, are clever, relevant and inspirational.
Below are 43 quotes in bold text which are relevant to business executives who want to live a regret-free life. I categorized the quotes by: aspiration, kindness, leadership, success and happiness. In a few instances, I have slightly paraphrased Mr. Brown’s original text – my apologies to Mr. Brown and his purist fans. My brief annotations follow each quote.
Aspire
1. Never give up when you truly believe. The person with big dreams is more powerful than the one with all the facts – the smartest person in the room seldom beats the one with the most passion.
2. Believe in love at first sight – be open to instant infatuation with respect to both people and business ideas.
3. Never laugh at anyone’s dreams – no one has the right to opine upon someone else’s desired future because no one can attest to the validity of an unrealized dream.
4. Find a job you like and you add five days to every week – I often tell my children), “I never worked at day at my startups because we were having too much fun.” Admittedly, not every day was a carnival, but I certainly enjoyed the majority of my startup workdays.
5. Every so often, let your spirit of adventure triumph over your good sense – good judgment arises from mistakes, mistakes arise from bad judgment. Thus, a bit of occasional bad judgment is good for you.
6. Great love and great achievements involve great risk – nothing ventured, nothing gained. Go venture.
7. Never let the odds keep you from pursuing what you know in your heart you were meant to do – entrepreneurs never calculate probabilities, even if the chances are one in a million, “one” is all you need to win.
The discount rate is one of the most frequently confused components of discounted cash flow analysis. What exactly is the discount rate and how does it work? What discount rate should I use in my analysis? These are all important questions to ask, and this article will explain the answers in detail. Read on for a deep dive into the concept of the discount rate as it relates to valuation and discounted cash flow analysis.
What is the discount rate? The discount rate is the rate of return used in a discounted cash flow analysis to determine the present value of future cash flows.
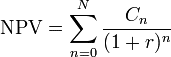
In a discounted cash flow analysis, the sum of all future cash flows (C) over some holding period (N), is discounted back to the present using a rate of return (r). This rate of return (r) in the above formula is the discount rate.
Most people immediately understand the concept of compound growth. If you invest $100,000 today and earn 10% annually, then your initial investment will grow to about $161,000 in 5 years. This happens because your initial investment is put to work and earns a dividend and/or appreciates in value over time.
When solving for the future value of money set aside today, we compound our investment at a particular rate of interest. When solving for the present value of future cash flows, the problem is one of discounting, rather than growing, and the required expected return acts as the discount rate. In other words, discounting is merely the inverse of growing.
When it comes to discounted cash flow analysis, your choice of discount rate can dramatically change your valuation. Consider the following chart showing the sensitivity of net present value to changes in the discount rate:
As shown in the analysis above, the net present value for the given cash flows at a discount rate of 10% is equal to $0. This means that with an initial investment of exactly $1,000,000, this series of cash flows will yield exactly 10%. As the required discount rates moves higher than 10%, the investment becomes less valuable.
This happens because the higher the discount rate, the lower the initial investment needs to be in order to achieve the target yield. As you can see in the chart above, the selection of the discount rate can have a big impact on the discounted cash flow valuation. For more background on the net present value (NPV), check out the Intuition Behind IRR and NPV and NPV vs IRR.
Since the discount rate matters so much, how do you go about selecting the appropriate discount rate for an individual investor? Non-corporate or individual investors normally consider their opportunity cost of capital when determining the appropriate discount rate.
What is the opportunity cost of capital? Simply put, it’s the rate of return the investor could earn in the marketplace on an investment of comparable size and risk. It’s the opportunity the investor would be giving up if he/she invested in the property or investment in question, thus the term “opportunity cost.”
For example, if you have $1,000,000 to invest, what are all of your available investment alternatives with similar risk profiles? Whatever the yield is on all of these alternative opportunities is the appropriate discount rate to use. Another way to think about this is that for an individual investor the discount rate is simply the individual investor’s required rate of return.
Selecting the appropriate discount rate for a corporate investor is a bit more difficult. Corporations often use the Weighted Average Cost of Capital (WACC) when selecting a discount rate for financial decisions. Broadly speaking, a company’s assets are financed by either debt or equity. A corporation can also use retained earnings, which are the after-tax earnings not distributed to shareholders in the form of a dividend.
The WAAC is simply the weighted average of each of these sources of financing. This is also commonly called the “hurdle rate”, because for an enterprise to be profitable it has to earn a return greater than the cost of capital. In other words, it must cross over the “hurdle” in order to be profitable.
The debt portion of the capital structure is typically in the form of short-term unsecured notes provided by commercial banks, and long-term debt is usually provided by bond investors. The equity portion of the capital structure is normally in the form of preferred stock and common stock. The interest paid on short and long term debt is deductible for tax purposes, whereas the dividends paid to shareholders is not. Any after tax earning a corporation generates that is not paid out to investors is kept as retained earnings.
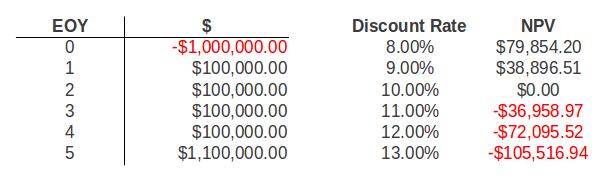
Consider the following example:
To find the before tax weight of each source of capital, you can simply multiply the percent of total figure for each source by the before tax cost of each source. For example, short-term debt comprises 10% of the total capital and has a cost of 3.75%. Multiplying these two figures together results in a before tax weight of 0.38%.
Completing this for each source of capital results in a total weighted average cost of capital of 6.80%. This is the appropriate discount rate to use for this corporate investor. Any investment that the company makes must at least achieve a 6.80% return in order to satisfy debt and equity investors. Any return greater than 6.80% will create additional value for the shareholders.
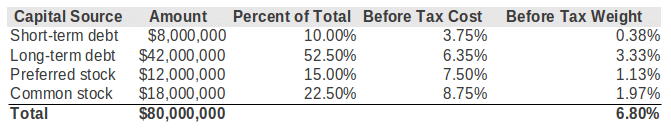
Another way to think about the discount rate is to look at historical asset returns for the investment in question. Consider the following chart showing historical asset returns between 1970-2010:
The above chart shows historical asset class returns for Treasury Bills, long-term U.S. government bonds, institutional-quality commercial real estate as measured by NCREIF, and stocks as measured by the S&P 500. Additionally, the chart breaks out the volatility and calculates the risk premium of each asset class over and above Treasury Bills, which are traditionally considered “risk-free” in finance.
As shown above, the risk premium on institutional quality commercial properties represented by the NCREIF index averaged 4.55 percent ( or 455 basis points). The risk premium on long- term bonds was 366 basis points, while the risk premium on stocks was the highest, at 596 basis points.
In finance, the total rate of return consists of two parts: the risk-free rate plus some risk premium (r + RP). For short-term investments, the traditional choice for the risk-free rate is the current T-Bill. However, because commercial real estate is a longer-term investment with an average holding period of 10 years, the appropriate risk-free rate is the average T-Bill rate expected over the investment horizon.
For a 10 year holding period, the 10-Year T-Bond would be an appropriate choice. As an aside, sometimes even the 10-Year T-Bond yield is adjusted downward to account for the “yield curve effect”, which is the additional risk premium already built into the T-Bond over and above the shorter term T-Bill yields.
If these historical risk premiums represent current expectations, then we can use the risk-free rate calculated, and add in the historical risk premium to determine the total expected return. For example, if the risk-free rate was determined to be 3%, then adding in the above 4.55% risk premium would suggest a total return expectation of 7.55% for institutional-quality commercial real estate.
Because what happened in the past is not a guarantee of what will happen in the future, it’s often useful to look at expected returns going forward. In addition to the historical returns discussed above, another approach to estimating the current expected total return is to simply ask investors what they expect.
Of course this is always easier said than done. Most larger commercial brokerage firms collect data on these return expectations on a regular basis, as do some appraisers and lenders. Additionally, there are several commercial real estate research firms that survey investor preferences on a regular basis. One of the most popular survey’s is the Korpacz survey. While expensive, this report is regularly used by institutional investors.
Because cap rate data is easier to obtain than investor IRR expectations, it’s also worth mentioning the relationship between the cap rate and the discount rate. You may recall the Gordon Model from our article on the cap rate:
This formula solves for Value, given cash flow (CF), the discount rate (k), and a constant growth rate (g). From the definition of the cap rate we know that Value = NOI/Cap. This means that the cap rate can be broken down into two components, k-g. That is, the cap rate is simply the discount rate minus the growth rate. Using some basic algebra we can of course re-arrange this handy equation and solve for the discount rate. This tells us that the discount rate is equal to the cap rate plus the growth rate.
Most medium and large brokerage firms issue quarterly market reports that include cap rates on recent transactions. Reporting cap rate data is much more common than reporting IRR expectations. This means you can estimate the appropriate discount rate based on current cap rates in your market. Simply take the relevant cap rate and add in a reasonable growth estimate and you’ll have an approximate discount rate to use in your discounted cash flow analysis.
One limitation to this approach is that cap rate data is based on proforma net operating income, not cash flow before tax. To account for this difference it’s sometimes common to simply adjust the cap rate downward by 100-200 basis points.
The discount rate is a crucial component of a discounted cash flow valuation. The discount rate can have a big impact on your valuation and there are many ways to think about the selection of discount rates. Hopefully this article has clarified and improved your thinking about the discount rate.
December 19, 2013 By Ben O’Grady
Sourced by: Property Metrics
One of the first steps in evaluating a commercial property is determining the total rentable square feet. While this might seem like a straightforward calculation, it unfortunately doesn’t always end up being so simple. This is particularly true for multi-tenant buildings. In this article we’ll go over how to calculate rentable square feet (RSF), usable square feet (USF), and the load factor, then we’ll tie it all together with a clear example.
Usable Square Feet
In a nutshell, usable square footage is the actual space you occupy from wall to wall. Usable square footage does not include common areas of a building such as lobbies, restrooms, stairwells, storage rooms, and shared hallways. For tenants leasing an entire floor or several floors, the usable square footage would include the hallways and restrooms exclusively serving their floor(s).
Rentable Square Feet
Rentable square footage is your usable square footage PLUS a portion of the building’s shared space. As mentioned above, shared space can be anything that is outside of your occupied space and is of benefit to you (lobbies, restrooms, hallways, etc). As a tenant in a commercial space, you pay for a portion of the shared space and thus your monthly rent is always calculated on RSF.
The increase in the the rentable square footage above your usable square footage is referred to variously as the “load factor,” “common area factor,” or “add-on factor.” This is generally in the 10-15% range and can be higher in some buildings. When evaluating commercial real estate space options, you’ll want to be aware of this factor so you know exactly what you’re getting and what you’re paying for.
How to Calculate Load Factor
Calculating the load factor is pretty straightforward. First, find out how much total floor area a building has. Then, subtract the shared square footage to determine the usable square footage. The owner or owner’s agent should be able to give you these numbers. Then divide the total floor space by the USF to get the load factor.
Rentable Square Feet Load Factor
Example: A 100,000 square foot building has 15,000 square feet of shared space. The usable square footage is 85,000 square feet. The load factor would be 1.176 (100,000 / 85,000). That would also be the same as saying the building has a load factor of 17.6%.
Rentable Square Feet vs Usable Square Feet Example
Let’s look at a quick scenario when comparing load factors and rentable square footage to see why it’s useful.
The situation
A tenant is looking at two different office spaces, both with 5,000 square feet of usable space and the exact same rental rates, but differing load factors.
Option A
The first suite has 5,000 usable square feet and has a 20% building load factor for an additional 1,000 sf (5000 x 20%) of rentable space. Thus, the rentable square feet is 6,000 square feet.
Option B
The second office has 5,000 usable square feet and a 15% load factor. The rentable square footage is 5,750 sf (5,000 x .15 = 750). Option B has less rentable square footage and thus would cost less per month for the same amount of usable space!
With the same rental rate, the tenant would pay more per month on his lease for Option A at 6,000 rentable square feet. However, one factor to consider is with higher load factors, are you getting better shared amenities that justify the cost? In some cases, a fancier lobby and shared kitchen area could be enough of a draw to justify the higher cost for the same amount of usable square footage.
As shown above, rentable square feet is not always so simple. To make matters worse, sometimes landlords will even fudge the load factor and USF numbers to the point where it becomes part of the negotiation process itself. As with all commercial real estate leases, always read the fine print so you understand exactly what you’re paying for and exactly what you’re getting in return.
Can investors stomach a side order of risk?
As investors dealt with so much fiscal uncertainty in 2013 — the budget deficit, potential tax increases, raising of the debt ceiling, and higher health insurance premiums associated with the Affordable Care Act just to name a few — it is almost a relief to get back to worrying about the basics. Concerns such as the economy, capital markets, and monetary policy, as well as geopolitical challenges, have taken a back seat in news reports and day-to-day conversations.
Even so, as investors search for alpha, or above-average expected returns in their real estate holdings, questions remain as they seek to balance their appetite for returns versus their apprehension of risk. Have the Federal Reserve’s extremely accommodative policies created asset price inflation in the commercial real estate market? Are we looking at a potential correction or potentially lower returns? Are we facing another inflection point for commercial real estate or will property values continue to appreciate and provide good annual returns? Which property types and locations have the most opportunity for solid returns in this uncertain climate? Is the risk systemic?
Although the U.S. has seen generally positive economic traction since the recovery began, growth continues to stumble along, with little inspiration beyond the addition of the various forms of quantitative easing, including very low short-term interest rates incorporated by the Federal Reserve. Even so, Real Estate Research Corp.’s institutional investment survey respondents projected that the economy would grow at a rate of approximately 2.4 percent in 2014, which is only slightly lower than the 2.6 percent growth projection that the International Monetary Fund issued for the U.S. economy.
In addition, some investors have noted that there is more capital available than solid product in which to invest, and as such, pricing has become quite aggressive for certain top-tier properties in the major markets. Further, as investors’ appetite for returns increases, their willingness to take on a little more risk has been increasing, and we are seeing increasing amounts of capital available for properties in secondary and tertiary markets.
While the availability of capital continues to increase for such properties, the gap between the availability and discipline of capital has been widening. As shown in Figure 1, the availability of capital rose to 7.6 on a scale of 1 to 10, with 10 being high, while the discipline of capital was rated at 6.4, as reported in the 3Q13 RERC Real Estate Report.
Despite repeated reassurance from the Federal Reserve about keeping interest rates low, the fragile markets were taken aback last spring when the Fed first introduced its plan to eventually begin tapering its qualitative easing program. The stock market sank and 10-year Treasury yield rates nearly doubled as investors faced a riskier future. Although the stock market has improved considerably since that time and the major indices have reached new highs, 10-year Treasury yield rates have been steadily increasing, indicating continued risk in the market.
During 3Q13, the 10-year Treasury rate increased 70 basis points to 2.7 percent, which is the fourth consecutive quarter of increases since its historic low in 3Q12. Figure 2 presents the spread between RERC’s required pre-tax yield rates, or internal rates of return, and 10-year Treasurys and also the spread between RERC’s required capitalization rates and 10-year Treasurys. Given the significant increase in the 10-year Treasury rate, the spreads for both the pre-tax yield rate and going-in cap rate over Treasurys have declined to 570 basis points and 400 basis points respectively. Although the spreads have been declining, they are still near their 10-year averages, showing the continued attractiveness of risk-adjusted returns for commercial real estate.
For the most part, commercial real estate investment trends have continued to improve over the past year, although the improvements have been achingly slow. RERC anticipates fundamentals to continue to make measured progress in 2014, in keeping with the slow-growing economy and sluggish job growth, while future risk appears to be primarily associated with increasing fiscal and political maneuvering related to the fall 2014 election.
In general, transaction volume has increased during the past 12 months, with total volume increasing approximately 25 percent on a year-over-year basis to $89.7 billion in 3Q13, according to Real Capital Analytics. Vacancy has decreased slightly for all property types in 2013 as absorption has increased and new construction was minimal, except in the apartment sector, while rents have increased only slightly according to Reis.
From the standpoint of returns, RERC’s required pre-tax yield and going-in and terminal cap rate expectations have continued to decrease in 2013, although they appear to have stabilized somewhat during the last few quarters as depicted in Figure 3. The “All Property Types Average” required pre-tax yield rate and required going-in and terminal cap rates for unleveraged properties further stabilized in 3Q13. RERC’s return expectations have nearly reverted to levels experienced before the credit crisis and Great Recession.
Office. With positive absorption throughout the year, the national office sector’s vacancy rate declined to 16.9 percent in 3Q13 from 17.2 percent a year earlier, according to Reis, and effective rents increased to $23.32 per square foot, an average of 2.3 percent for the year. Total office transaction volume for third quarter was $24.5 billion, a 36-percent increase over the previous year’s volume, per RCA, while the average price increased 12 percent to $233 psf. However, RERC’s average required pre-tax yield rate (discount rate) for unleveraged office properties declined to 8.1 percent in 3Q13, while the required going-in and terminal cap rates decreased to 6.5 percent and 7.2 percent, respectively. As for 2014, Reis projects the vacancy rate to continue to improve, declining to 16.5 percent by the end of the year, and for rental rates to increase 3.4 percent.

Industrial. The availability rate for the industrial sector declined to 11.7 percent during 3Q13, according to CBRE. This was a 30 basis point decline from the previous quarter and a 130 basis point decline from the previous year. According to Newmark Grubb Knight Frank, asking rents for industrial properties increased to $5.72 psf in third quarter. Transaction volume for the industrial sector increased to $14.2 billion in third quarter, a 70 percent increase from 3Q12, while the average price inched up slightly to $65 psf, according to RCA. RERC’s required pre-tax yield rate for unleveraged industrial properties remained flat at 8.1 percent in third quarter, and the required going-in cap rate fell 20 basis points to 6.5 percent as the required terminal cap rate held steady at 7.2 percent. Although absorption is still outpacing completions, both are expected to increase in 2014, according to NGKF data, and asking rent is projected to increase to $5.95 psf.
Retail. Positive absorption continued for the neighborhood/community retail sector, with the average vacancy rate dipping to 10.5 percent in 3Q13 from 10.8 percent in 2012, according to Reis. Effective rents increased to $16.74 psf, which was up only 0.4 percent for the quarter and 1.4 percent YOY. In addition, retail property transactions increased by approximately 25 percent to $19.2 billion in 3Q13, and more than doubled during the past year, according to RCA. Although the average price of retail space declined slightly to $170 psf in 3Q13 from the prior quarter, this was a 13.0 percent increase over year-ago prices. RERC’s required pre-tax yield rate for unleveraged retail properties increased slightly to an average of 8.0 percent in 3Q13, as the required going-in cap rate fell slightly to 6.4 percent and the required terminal cap rate increased 20 basis points to 7.1 percent. In 2014, neighborhood/community retail vacancy is expected to decline to 10.1 percent and effective rents should increase 2.2 percent on an annual basis, per Reis.
Multifamily. With 123,518 completions in 3Q13 — the highest amount since 2009 — the vacancy rate for the apartment sector still managed to decline to 4.2 percent in third quarter from 4.7 percent a year ago, according to Reis. Effective rent growth increased 3.2 percent on an annual basis to $1,074 per unit in third quarter. Although transaction volume increased about 20 percent to $22.1 billion in 3Q13 from the previous quarter, volume was down 20 percent from year-ago figures, according to RCA. In addition, the price for apartment properties has been inching downward over the past year to an average of $107,240 per unit in 3Q13. RERC’s required pre-tax yield and going-in and terminal cap rates for unleveraged apartment properties remained unchanged in third quarter. Reis does not expect vacancy to improve much in 2014, but effective rent should improve approximately 3.3 percent annually for this sector.

Hotel. Fundamentals for the hotel sector, which is generally viewed as slightly more risky than the other property sectors, have been steadily improving over the past year. According to Smith Travel Research, occupancy increased to 67.8 percent in 3Q13, a YOY increase of 5.8 percent. In addition, the average daily rate climbed to $115.47, an increase of 8.3 percent from the previous quarter, while revenue per available room rose 14.5 percent to $78.31. Unlike the other property sectors, transaction volume and pricing declined for the hotel sector in 3Q13 from the previous quarter, but the third-quarter volume of $5.7 billion and the average price of $136,473 per unit was 14.0 percent higher than year-ago volume and price, per RCA. In addition, investors are requiring a slightly higher risk premium for investing in hotel properties, and RERC’s required pre-tax yield rate increased 20 basis points to 10.0 percent in third quarter for unleveraged hotel properties. RERC’s required going-in cap rate remained unchanged at 8.0 percent, while the required terminal cap rate increased slightly to 8.7 percent. After minimal supply growth during the past couple years, hotel construction is expected to begin to increase, with occupancy, ADR, and RevPAR increasing at a similar pace in 2014.
RERC expects appreciation on commercial real estate — and total returns by extension — to slow slightly in 2014 as we gain clarity in monetary policy and other issues. If the Federal Reserve tapers its policy of monthly bond purchases soon, money may be less available and become more expensive in 2014. In addition, appreciation is likely to decline as sales of class B or good-quality assets in second-tier markets become more common.

RERC forecasts aggregate National Council of Real Estate Investment Fiduciaries values as presented in the NCREIF Property Index to increase by approximately 2.75 percent throughout 2014. As of 3Q13, year-to-date values have increased by 3.9 percent and total return has increased by 8.3 percent. RERC’s projection is bracketed by upside and downside scenarios that reflect a projected value change in 2014, with the base case near 2.75 percent for appreciation. Add an income return of 6.0 percent and total returns in 2014 are expected to have a base case near 8.75 percent on an unleveraged basis for the year.
Although commercial real estate returns were mostly favorable in 2013, the risk for commercial real estate is inching up, as demonstrated in Table 1, where the 3Q13 return vs. risk rating for commercial real estate overall declined to 5.6 on a scale of 1 to 10, with 10 being high. The ratings in this table also show that investors anticipate slightly lower near-term returns in comparison to the amount of risk for the office and industrial sectors, and slightly better returns compared to the risk for the retail and apartment sectors.
Further, RERC’s value vs. price rating, also shown in Table 1, declined slightly for commercial real estate overall in third quarter, as well as the ratings for the office, industrial, and retail sectors, indicating that the value is declining slightly in relation to the price. As depicted, the value vs. price rating for the apartment sector has already declined to 4.8 on a scale of 1 to 10, with 10 being high, suggesting that the value for this sector is already generally less than the price of this property sector. Interestingly, the value vs. price rating for the hotel sector was slightly higher, reflecting slightly higher value in relation to the price.
While many wonder whether the return on commercial real estate, particularly in challenged markets, will outweigh its risk, it is important to remember that there is an element of risk in every investment. However, broadly speaking, RERC believes that commercial real estate is still a good investment compared to the alternatives, and that returns are available on a risk-adjusted basis to astute investors.

The investment characteristics for real estate are more transparent than those for many other investments. Part of the value of the asset class is that it is a tangible asset vs. a paper asset. In addition, commercial real estate offers reasonable returns, and although the returns are generally not as high as recent stock market trends, they are not as volatile either. Finally, commercial real estate returns are based on both appreciation and dividends, therefore providing a reliable source of income. And when all is said and done, that may be as good a way to pursue alpha as any.
Kenneth P. Riggs Jr., CCIM, CRE, MAI, is president of Real Estate Research Corp. (www.rerc.com) and publisher of the quarterly RERC Real Estate Report. For more information or for a special CCIM discount to the report, contact RERC at publications@rerc.com.
Although commercial real estate has generally recovered in many of the major coastal markets and prices have returned to pre-recession levels — and some reports show prices surpassing those levels in some cities — there are still good opportunities to purchase quality properties throughout the U.S.
• Both debt and equity will likely be more expensive in 2014, although liquidity should be available for good investments. If you haven’t already done so, lock-in low interest rates soon.
• The coastal markets are likely to be too expensive for the majority of commercial real estate investors, but there should be good opportunities for pursue solid risk-adjusted returns in the secondary and tertiary markets.
• Niche properties such as storage, student housing, and medical-related facilities offer diversity from core property selections.
• Property fundamentals are not expected to increase broadly in 2014, as economic growth is expected to remain sluggish.
• Total returns are likely to decline slightly in 2014, as the appreciation component of commercial real estate investment is likely to see downward pressure compared to 2013.
• Generally speaking, look for industrial properties to continue to perform well, along with neighborhood/community retail properties.
– See more at: http://www.ccim.com/cire-magazine/articles/323388/2014/01/hungry-returns#sthash.SKVJpJ2X.dpuf
Paraphrased from article by By Michael Bull, CCIM |
2014 should be another year of improvement across all commercial real estate sectors, according to the “Emerging Trends in Real Estate 2014” report conducted by PricewaterhouseCoopers (PwC) and the Urban Land Institute (ULI).
Produced for the last 35 years, Emerging Trends is one of the most anticipated and respected forecasts for U.S. real estate. Interesting not only for its analysis of past and current performance trends to forecast future results, the report also looks forward by interviewing 1,000 U.S. real estate executives, investors, developers and market experts about their plans and market predictions.
Answering the Interest Rate Question
“While we were doing our interviews from July through early October, interest rates were on everybody’s mind,” said Mitch Roschelle, partner and U.S. real estate advisory practice leader for PwC. “In 2010, 17.7 percent thought the real estate market would be good to excellent. In this year’s survey, 67.8 percent thought 2014 will be good to excellent, so that tells you that rates won’t chill the market.”
If net operating income growth remains on pace with an increase in the cost of capital, the market can digest a rise in interest rates, Roschelle said. Additionally, lenders indicated that underwriting standards are loosening and spreads are compressing because of the profitability of banks, he added.
Lending Environment
As the economy continues to improve, lenders are getting back in the real estate game, guests said. A significant amount of capital still flows into the multifamily sector, but there is also capital available for retail projects in secondary markets, said Andy Warren, director of real estate research for PwC.
“Lenders are beginning to expand what they are willing to look at in terms of deals,” he added. Regional banks have started to open up and contribute more to the lending environment, Warren said.
“CMBS will be a big story in 2014,” Roschelle affirmed. “In fact, it’s leading the list of lenders for 2014. The CMBS market lagged in the past, so that’s big.”
Looking ahead to 2015, shadow banking will be a big trend, Roschelle said. “Funds are aggregating capital and putting it out in the form of somewhat conventional financing for commercial real estate,” he said. “It’s going to be bigger and bigger in the months to come.”![]()
Investors Bullish on Texas and Florida
While technology-driven markets such as San Francisco and San Jose, Calif., remain high on investors’ lists, Texas has emerged as an important investment target, Warren said. “Dallas, Houston, Austin and Fort Worth are all in the top 10 markets for investors,” he said. “If you add in San Antonio, which is in the top 20, you have all four major metro areas in Texas as top markets for this year.”
One notable change in the survey was the decline of investor interest in the nation’s capital. “Washington, D.C., continued to perform strongly during the downturn because the federal government held up. Now with the discussions about the fiscal cliff and budget ceiling, it’s beginning to have a blow-back effect on the local market,” Warren added.
The Impact of Millennials on Commercial Real Estate
“People between the ages of 15 and 29 years old represent 28.5 percent of the population, the single largest group,” Roschelle said. “Decisions about commercial real estate are going to be made around Millennials for years to come.”
“Apartments are the first thing that come to mind,” Warren said. Millennials are looking for apartments in an urban setting that foster a “live, work, play” environment. “This is having a huge impact on major cities.”
However, the impact of Millennials expands beyond the multifamily market. Office environments are being reconfigured into a more open floor plan in order to attract and retain Millennials, Warren added.
Retailers are following Millennials from suburban to urban markets, developing new store layouts that will work in urban areas. The industrial market has been impacted as well because online sales are up, which means fulfillment centers will continue to be created to meet this uptick in demand. “Millennials have touched much more than just apartments,” Warren said.
January 8, 2014
Some commercial real estate brokers like the idea of owning their own company and some do hang their own shingle. They soon find the combination of the required time, costs and risks create less income and value than remaining a productive broker at an existing firm. Why does this continually happen and is there an alternative for brokers to benefit from company synergy, equity in deals and an override commission structure without the detriments?
 Economies of scale come into play, as well as capture of market share. It can be difficult to compete, as the expense of the tools and resources needed to be competitive can be difficult to budget . There are many other aspects that create issues for the broker turned business owner including the fact that productive sales people do not typically enjoy or make good managers.
The perfect situation for a broker would be the benefits of company synergy, equity in deals and an override commission structure, but without any of the detriments. It would be nice to have a prestigious title ownership, plus an opportunity to participate in equity deals, team synergy and override commission structure each year. Can a broker in a commission based industry achieve this without the requisite risks, costs and hassle of running a firm? Contact us confidentially to explore the possibilities and see if you qualify to be a part of the growth and opportunity of TMC-The Mahr Company going forward for 2014.
1. Hyde Park Village sold for $45 million in 2013 to WS Development in Boston. Expect to see the new owners begin to put their fingerprint on the retail and restaurant destination in 2014.
2. St. Petersburg’s iconic waterfront has been under the microscope of city planners and the Urban Land Institute is expected to present a final report in January 2014.
3. Florida State Fairgrounds’ governing board is considering developer pitches and could choose one this summer that would allow for some construction on the valuable land to help raise money to repair existing infrastructure.
4. Channelside Bay Plaza looked like it was on the road to recovery in 2013 when the Port of Tampa agreed to buy the property outright for $5.75 million and then see what could be done to reinvigorate it. A new lawsuit from Liberty Channelside LLC alleging that the port purposefully spiked Liberty’s offer on the plaza will likely delay any resolution at Channelside while the court considers the suit.
5. Nathan Benderson Park’s world-class rowing facility is complete and boosters already have booked national and international regattas in 2017 and 2018. The park’s management is working to fill the calendar between now and then to help show that the $40 million investment can pay economic impact dividends.
6. A well-rested piece of dirt on Westshore Boulevard just north of Gandy Boulevard that once was home of Georgetown Apartments has the potential to sell in 2014. It has been seen for years as one of the most valuable development parcels in the region. If it sells, how the parcel develops bears close watching for insights into current trends in commercial and residential real estate locally.
7. A proposed site for future Raymond James Financial Inc. expansion in Pasco County is worth watching in 2014. The company has an agreement to purchase 65 acres that could hold as many as six four-story office buildings, and the project has seemingly been slow to evolve.
8. Bill Edwards bought St. Petersburg’s defunct Baywalk downtown shopping center with dreams of bringing it back to life. It’s hard to argue that Baywalk is the center of his attention since he had to significantly scale down his Mortgage Investors Corp. in the face of new federal regulations and he just bought the Tampa Bay Rowdies. Edwards and his team have been methodical in its search for the right tenant mix with the hope of turning things around.
9. The Mall at University Town Center opens in October 2014 and will change Sarasota’s retail landscape. Several anchor department stores will leave other malls in the area for UTC.
10. The long-stalled Cypress Creek Town Center in Pasco County could be under construction as early as summer, 2014 – this time as an outlet mall, published reports show. Environmental litigation held up the project at State Road 56 and Interstate 75 for years. Simon Property Group could have the mall ready to open in summer 2015.
Happiness Health and Well Being for 2014 from TMC-The Mahr Company
Emerging Trends Sourced by the ULI [Urban Land Institute]
Commercial real estate is reaching an inflection point where “valuations will no longer be driven by capital markets.” In 2014, Emerging Trends interviewees expect “space market fundamentals and property enhancements to emerge as the primary drivers of total returns,” reducing the reliance on falling capitalization rates and high amounts of leverage.
The real estate recovery will gain momentum in 2014. This should be good news to an industry that has experienced a recovery of fundamentals that has been much slower than it is used to after a recession. In fact, the pace of the recovery can make it difficult to spot the signs of improvement until they are in full swing. At first glance, many of the trends identified for 2014 are similar to those identified in previous years. These trends were relevant when originally identified, but the slower pace of this economic recovery prevented them from coming to fruition in the expected time frame. The difference for 2014 is that the market has progressed further through the economic and real estate cycles and we are now seeing real evidence that the trends have the momentum to finally make an impact on the real estate market.
The real estate market continues to move through the recovery phase of this cycle. The trends identified for 2014 portend both opportunities and challenges for investors in 2014. Economic and demographic changes will drive demands for real estate that are familiar and some that will require the industry to adapt. Equity and debt capital will continue to be attracted to the asset class, and the deployment of this capital will include more investment strategies that will involve a wider set of markets and property types. The economic recovery is projected to continue in 2014—and with it rising interest rates. The expected impact of rising interest rates ranges from little to potentially leading capital to flow into alternative asset classes. Despite the wide range of opinions, everyone is convinced that the search for returns through cap rate compression will become the search for returns through improving fundamentals and/or operational improvements.
The year 2014 may well be the year that the real estate markets “recovers from the recovery.” Real estate professionals interviewed for Emerging Trends expect growth to be sufficient to generate consistent and growing demand for commercial real estate across all property types. As one fund manager says of the moderate 2.5 percent gross domestic product (GDP) growth in the second quarter of 2013, “That is not huge, but it is enough to create demand for real estate product—that is, demand for space and improving rent—because at the same time there’s almost no new supply. It’s a sweet spot for real estate.” An economist notes, “We have a new paradigm here. It is not the kind of recovery we have seen before with 250,000 new jobs a month. It’s a recovery with 100,000-plus jobs a month.”
“With the economy in a position where the tailwinds are now stronger than the prevailing headwinds, 2014 should be a year when we see real estate fundamentals improve in sectors beyond the already very healthy multifamily sector—and in a number of markets—to a point where we could see above inflation rate rental growth,” says a fund manager. According to Emerging Trends 2014 interviewees, the tailwinds include “good if not great” job growth—in industries that are, by no small coincidence, magnets for commercial real estate investment (energy, technology, health care and biological research, and, to some extent, education and financial services)—solid corporate profits, and a recovery in the housing market. These tailwinds are expected to trump the headwinds, which include a “stubbornly high” unemployment rate, uncertainty over government regulation and fiscal policy, and concern about the rising cost of debt capital.
The expected breadth of the recovery is illustrated by the view of Emerging Trends survey respondents toward the outlook for real estate business prospects. Prospects for almost all types of real estate businesses were rated more optimistically for 2014 than in last year’s survey for 2013. The improvement in business outlook was most significant for homebuilders, for whom prospects are not only expected to be significantly better than last year but whose prospects have more than doubled in the past two years. As a result, homebuilders have moved from the weakest real estate businesses in 2012 to one of the strongest in 2014. Business prospects for commercial bank real estate lenders and commercial mortgage–backed securities (CMBS) lenders and issuers also improved noticeably.
