By: Robert Schmidt
Cash on cash return in commercial real estate is important when you are evaluating investment real estate transactions. What is the cash on cash return and how do you calculate it for a commercial property? What are the limitations of using this method? In this article we’ll tackle these questions and also provide some detailed examples of the cash on cash return.
Cash on Cash Return Formula
Before diving into some cash on cash return examples, it is important to have a sound understanding of exactly what the term means. So, let’s start with the basics. First, here’s the cash on cash return formula:

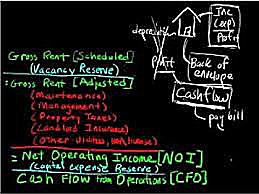
As shown in the cash on cash formula above, the cash on cash return is a simple measure of investment performance that is calculated as cash flow before taxes divided by the initial equity investment. The cash flow before tax figure for each year is calculated on the real estate proforma, and the initial equity investment is simply the total purchase price less any loan proceeds.
Cash on Cash Return Example
Next, let’s take a simple example to illustrate the cash on cash return. Suppose you are evaluating an office building with an estimated Year 1 Cash Flow Before Tax of $60,000. Also, assume that the negotiated purchase price of the property is $1,200,000 and you are able to secure a loan for $900,000 (75% Loan to Value). What’s your cash on cash return for year 1?

The calculation itself is pretty simple – your cash on cash return for year 1 would be the Year 1 cash flow divided by your total cash out of pocket, which equals 20%. So what does this simple measure of investment performance tell you? Using only the figures above, the cash on cash return tells you that your year 1 return on investment is 20%. This of course assumes that your initial equity investment figure and also your cash flow projection is correct.
Cash on Cash Return Limitations
The cash on cash return is a simple measure of investment performance that is quick and easy. It can be a good starting point for quickly filtering out potential investment properties. But don’t be fooled by the many limitations of the cash on cash return.
Consider the following series of cash flows:

The year 1 cash on cash return in the levered example above shows a 3% cash on cash return. To find this simply take the end of year (EOY) 1 cash flow of $15,805 and divide it by the initial equity investment of $515,000.
But as you can see in the table above, the internal rate of return (IRR) is 10.71%. This suggests that according to a discounted cash flow analysis, the investment is actually much better (almost 4x better) than what’s indicated by the cash on cash return. If you were only using the cash on cash return as an investment filter, then you’d pass up this opportunity to earn nearly 11%.
The reason why the cash on cash return is so much lower than the IRR in the example above is because the cash on cash return ignores the other 9 years of operating cash flows in the holding period. Plus, it also ignores the reversion cash flow at the end of year 10 that comes from the sale of the asset. Without taking into account these additional cash flows that occur over the holding period, it’s impossible for the cash on cash return to accurately reflect the return characteristics of the property.
The same is true when looking at the unlevered example above. The cash on cash return in the unlevered series of cash flows above is 6.2% ($95,000 divided by $1,515,000), and the IRR is 7.51%. This series of cash flows doesn’t produce as big of a gap as in the levered example, but it’s still a difference. Without taking into account all cash flows over the holding period, the gap between the cash on cash return and the IRR will be unknown.
As a side note – keep in mind that this can work in reverse too. In the above examples the IRR was higher than the cash on cash return because operating cash flows grow over the holding period and the sales proceeds of the asset are favorable. But it could also be the case that many leases will expire a few years after acquisition, causing operating cash flow to decline and the final reversion cash flow to be lower. This could produce the opposite result where the cash on cash return ends up being more favorable than the IRR.
Discounted Cash Flow Analysis
As shown in the example above, a discounted cash flow analysis provides a much more complete return profile of an investment property. Sure, simple measures of investment performance like the cash on cash return work as a starting point in your evaluation. But as your interest in a property becomes more serious, so should your analysis.
A discounted cash flow analysis uses concepts of the time value of money to value a commercial real estate asset. When looking at a time period extending out over a number of years, a DCF analysis estimates future cash flows and discounts cash flows back to the present. Using the discounted cash flow analysis will require forecasting future cash flows (incoming and outgoing), determining the necessary total return, and then discounting the forecasted cash flows back to the present at the necessary rate of return.
Sourced By: Property Metrics