Category Archives: CRE Data News Info

CRE Demand Cycle

TMC The Mahr Company Shares: Most feel that the recession officially ended back in 2009 and the economy has been growing ever since, yet it still feels like a recession to some people. Why is this and how long will it take to get back to normal? More importantly, what does this mean for commercial real estate? The CCIM Institute has a demand cycle flow chart that illustrates how employment drives demand for commercial real estate. As shown below, demand for commercial real estate is directly or indirectly driven by employment growth. Employment growth drives population growth and disposable income. Office and industrial demand is driven by employment growth. Industrial, residential, and hospitality demand is driven by population growth. And hospitality and retail demand is driven by disposable income. Contact us directly as to how we can assist you to best position your business/professional model to take advantage of these trends..

We Find Solutions through Creative Problem Solving and Execution:

TMC-The Mahr Company = SUCCESS in the achievement of your goals

Success>

Our Services solve your problems, saving you time and money.
The TMC team offers focused and skilled professional services, tailored to achieve your goals

Understanding Cash on Cash Return in Commercial Real Estate

Cash Fow

By: Robert Schmidt
Cash on cash return in commercial real estate is important when you are evaluating investment real estate transactions. What is the cash on cash return and how do you calculate it for a commercial property? What are the limitations of using this method? In this article we’ll tackle these questions and also provide some detailed examples of the cash on cash return.

Cash on Cash Return Formula

Before diving into some cash on cash return examples, it is important to have a sound understanding of exactly what the term means. So, let’s start with the basics. First, here’s the cash on cash return formula:

cash_on_cash_return_formula

As shown in the cash on cash formula above, the cash on cash return is a simple measure of investment performance that is calculated as cash flow before taxes divided by the initial equity investment. The cash flow before tax figure for each year is calculated on the real estate proforma, and the initial equity investment is simply the total purchase price less any loan proceeds.

Cash on Cash Return Example

Next, let’s take a simple example to illustrate the cash on cash return. Suppose you are evaluating an office building with an estimated Year 1 Cash Flow Before Tax of $60,000. Also, assume that the negotiated purchase price of the property is $1,200,000 and you are able to secure a loan for $900,000 (75% Loan to Value). What’s your cash on cash return for year 1?

cash_on_cash_return_example

The calculation itself is pretty simple – your cash on cash return for year 1 would be the Year 1 cash flow divided by your total cash out of pocket, which equals 20%. So what does this simple measure of investment performance tell you? Using only the figures above, the cash on cash return tells you that your year 1 return on investment is 20%. This of course assumes that your initial equity investment figure and also your cash flow projection is correct.

Cash on Cash Return Limitations

The cash on cash return is a simple measure of investment performance that is quick and easy. It can be a good starting point for quickly filtering out potential investment properties. But don’t be fooled by the many limitations of the cash on cash return.

Consider the following series of cash flows:

cash on cash return limitations

The year 1 cash on cash return in the levered example above shows a 3% cash on cash return. To find this simply take the end of year (EOY) 1 cash flow of $15,805 and divide it by the initial equity investment of $515,000.

But as you can see in the table above, the internal rate of return (IRR) is 10.71%. This suggests that according to a discounted cash flow analysis, the investment is actually much better (almost 4x better) than what’s indicated by the cash on cash return. If you were only using the cash on cash return as an investment filter, then you’d pass up this opportunity to earn nearly 11%.

The reason why the cash on cash return is so much lower than the IRR in the example above is because the cash on cash return ignores the other 9 years of operating cash flows in the holding period. Plus, it also ignores the reversion cash flow at the end of year 10 that comes from the sale of the asset. Without taking into account these additional cash flows that occur over the holding period, it’s impossible for the cash on cash return to accurately reflect the return characteristics of the property.

The same is true when looking at the unlevered example above. The cash on cash return in the unlevered series of cash flows above is 6.2% ($95,000 divided by $1,515,000), and the IRR is 7.51%. This series of cash flows doesn’t produce as big of a gap as in the levered example, but it’s still a difference. Without taking into account all cash flows over the holding period, the gap between the cash on cash return and the IRR will be unknown.

As a side note – keep in mind that this can work in reverse too. In the above examples the IRR was higher than the cash on cash return because operating cash flows grow over the holding period and the sales proceeds of the asset are favorable. But it could also be the case that many leases will expire a few years after acquisition, causing operating cash flow to decline and the final reversion cash flow to be lower. This could produce the opposite result where the cash on cash return ends up being more favorable than the IRR.

Discounted Cash Flow Analysis

As shown in the example above, a discounted cash flow analysis provides a much more complete return profile of an investment property. Sure, simple measures of investment performance like the cash on cash return work as a starting point in your evaluation. But as your interest in a property becomes more serious, so should your analysis.

A discounted cash flow analysis uses concepts of the time value of money to value a commercial real estate asset. When looking at a time period extending out over a number of years, a DCF analysis estimates future cash flows and discounts cash flows back to the present. Using the discounted cash flow analysis will require forecasting future cash flows (incoming and outgoing), determining the necessary total return, and then discounting the forecasted cash flows back to the present at the necessary rate of return.

Sourced By: Property Metrics

Top 10 Reasons to Move to Tampa Bay

Image

Top 10 Reasons to Move to Tampa Bay

Sourced By: Image

1. WORKFORCE

Tampa Bay ranked among the top 10 large metro areas for college-educated young talent on the move. The latest Census data reveals that young people aged 25 to 29 are increasingly more mobile and willing to move to new cities, very often in new states, in search of jobs.

2. K-12 EDUCATION

Florida leads the nation in high school seniors taking Advanced Placement exams at nearly 50 percent. Florida also ranks sixth in the nation for the percentage of students who score a 3 or higher on the AP exam at 23.9 percent, compared to the national average of 18.1 percent.

3. PROGRESSIVE TRAINING

An independent analysis of the CareerEdge Funders Collaborative by Urban Market Ventures found that the investments made by the nonprofit workforce-development program is producing millions of dollars in new wages and economic impact for the Tampa Bay region.

4. MILITARY INVESTMENT

Tampa Bay is home to MacDill Air Force Base, the only military installation that hosts two, four-star Combatant Commands, the U.S. Central Command and U.S. Special Operations Command. MacDill contributes $5 billion annually to the greater Tampa Bay economy.

5. AMAZING PARKS AND RECREATION

Tampa’s Curtis Hixon Park was named among America’s Best New Parks by The Atlantic Cities. Completed in 2011, the waterfront park serves as a more natural connection between the water, downtown, and the new Children’s Museum and Tampa Art Museum. Tampa Bay’s beloved public spaces spread throughout the region provide gathering places for families, friends, colleagues, and events from small to large scale.

6. PROMISING AND ADMIRED COMPANIES

Some of America’s most promising companies are located in Tampa Bay. Sarasota-based Internet communication systems and service provider, Star2Star Communications was named among America’s 100 Most Promising Companies by Forbes. The company also made the 2011 Inc. 500 list of fastest growing private companies.

7. INNOVATIVE UNIVERSITIES

The University of South Florida is ranked 50th in the nation for research expenditures by the National Science Foundation among all U.S. universities, public or private, joining the ranks of Johns Hopkins, Stanford, Yale and Harvard.

8. EXPANSIVE MEDIA REACH

The Tampa Bay region is the 14th largest television media market in the country, with 1.79 million TV households, according to Nielsen Media Research. That means Tampa Bay has 1.6 percent of all television households in the United States. It is the largest market in Florida – surpassing Miami. If you’re looking for media exposure, you’ve found it.

9. LOW COST OF DOING BUSINESS

According to a KPMG business cost study, the Tampa Bay market is the nation’s lowest cost large market for Corporate Services, International Financial Services and Shared Services – a testament to strong business, financial and data services sector in Tampa Bay.  KPMG’s 2012 Competitive Alternatives study measured 26 significant cost components over a 10 year planning horizon.  Bottom line – Tampa Bay is a great place for business.

10. HOT ENTREPRENEURIAL ENVIRONMENT

According to FastCompany Magazine, Florida’s start-up environment is soaring high. From the HuB in Sarasota to Tampa Bay WaVE’s First WaVE program to large events such as Start-Up Weekend and initiatives like the Tampa Bay 6/20 Plan, Tampa Bay’s entrepreneurial environment is setting up for start-up success.

We Are Dedicated To Serving YOU

We are dedicated to serving you. To being the best we can be in your service and in the accomplishment of your goals. As such we embrace this approach to being a more efficient, productive and entrepreneurial business to best serve you.

The below was created by: Anna Vital infographic author http://anna.vc/

Image

TMC-The Mahr Company EXCELLENCE IN THE DETAILS:
Selectively working with clients and prospective clients, while building lifelong working relationships.
Our Services solve your problems, saving you time and money.
The TMC team offers focused and skilled professional services, tailored to achieve your goals

Lessons Learned From Outside The Industry

ImageTMC The Mahr Company lessons from outside the industry: [The Seattle Seahawks, Bono and U2, and Bank of America]: (1) Reinvent with CANEI (Constant and Never Ending Improvement), (2) Stay with or ahead of trends, (3) Brand, Promote, Execute, Deliver,(4) Contribute to the greater good, (4) Dare to excel and surround yourself with talented motivated people desiring the same, (5) Do not accept other’s preconceived expectations,(6) Failure is not an option, Take action and act as if it is impossible to fail, (7) Proceed as if limits to your ability do not exist: The Seattle Seahawks Nail it. Nike transforms their uniforms to perhaps the coolest in the NFL, Bono and U2 deliver for the Bank of America in support of RED with “Invisible”, Coach Carroll assembles a team with talent to spare. they execute and deliver…..   Follow this link for U2’s “Invisible” http://bit.ly/1iljxDF

Difference Between Cap Rate and Discount Rate

Image

Difference Between Cap Rate and Discount Rate

By propertymetrics

What is the difference between a cap rate and a discount rate? Because these concepts are often confused, this article will discuss the difference between a capitalization rate and a discount rate in commercial real estate, and leave you with a clear understanding of the two concepts.

First, let’s go over a couple of definitions, and then we’ll dive into a specific example.

Cap Rate

The capitalization rate, often just called the cap rate, is the ratio of Net Operating Income (NOI) to property asset value. So, for example, if a property was listed for $1,000,000 and generated an NOI of $100,000, then the cap rate would be $100,000/$1,000,000, or 10%.


cap rate


What is a cap rate in commercial real estate useful for? Because individual properties differ greatly in size and magnitude, it’s helpful to talk about property prices and values in a common language. Thinking of property value per dollar of current net income achieves this objective.

The cap rate is simply a measure that quantifies property value per dollar of current net income. Another way to think about the cap rate is that it’s the inverse of the popular price/earnings multiple used in the stock markets.

Discount Rate

The discount rate is the rate used in a discounted cash flow analysis to compute present values.

When solving for the future value of money set aside today, we compound our investment at a particular rate of interest. When solving for the present value, the problem is one of discounting, rather than growing, and the required expected return acts as the discount rate. In other words, discounting is merely the inverse of growing.

What is the discount rate used for in commercial real estate analysis? In commercial real estate the discount rate is used in a discounted cash flow analysis to compute a net present value. Typically, the investor’s required rate of return is used as a discount rate, or in the case of an institutional investor, the weighted average cost of capital. This ensures that the initial investment made in a property achieves the investor’s return objectives, given the projected cash flows of the property. The intuition behind IRR and NPV is that it allows us to determine how much an investor should pay for a property, given his required rate of return, or discount rate.

Cap Rate vs Discount Rate

So, back to the original question – what’s the difference between the cap rate versus the discount rate? The cap rate allows us to value a property based on a single year’s NOI. So, if a property had an NOI of $80,000 and we thought it should trade at an 8% cap rate, then we could estimate its value at $1,000,000.

The discount rate, on the other hand, is the investor’s required rate of return. The discount rate is used to discount future cash flows back to the present to determine value and account’s for all years in the holding period, not just a single year like the cap rate.

If a property’s cash flows are expected to increase or decrease over the holding period, then the cap rate will be a misleading performance indicator. Consider the following two investment alternatives:

cap rate vs discount rate

Both properties have a cap rate of 10% based on the NOI in year 1. But clearly the cash flows are better for Building B and it therefore provides a higher rate of return. The exact rate of return can be quantified using the Internal Rate of Return (IRR). Also, assuming equal risk, any rational investor should be willing to pay more for Building B because its future cash flows are expected to grow more than Building A’s. But how much more could you pay for Building B while still achieving your required return?

By completing a multiyear discounted cash flow analysis we could quantify exactly how much we can pay for this property with a Net Present Value (NPV), given an investor’s discount rate. The cap rate, on the other hand, will not be able to answer this question for us. In short, while the cap rate and the discount rate may appear similar, they are two different things used for different purposes.

Key To Commercial Real Estate Investing is Timing

The Key To Investing in Commercial Real Estate Is Timing. Ask us how we can assist you in identifying the right strategies for your commercial real estate investments, whether acquisitions or dispositions.

What You Should Know About The Cap Rate

What You Should Know About The Cap Rate

Sourced by Property Metrics

The capitalization rate is a fundamental concept in the commercial real estate industry. Yet, it is often misunderstood and sometimes incorrectly used. This post will take a deep dive into the concept of the cap rate, and also clear up some common misconceptions.

Cap Rate Definition

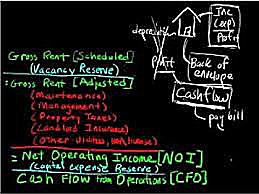
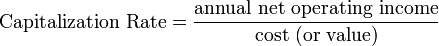
What is a cap rate? The capitalization rate, often just called the cap rate, is the ratio of Net Operating Income (NOI) to property asset value. So, for example, if a property was listed for $1,000,000 and generated an NOI of $100,000, then the cap rate would be $100,000/$1,000,000, or 10%.

cap_rate

Cap Rate Example

Let’s take an example of how a cap rate is commonly used. Suppose we are researching the recent sale of a Class A  office building with a stabilized Net Operating Income (NOI) of $1,000,000, and a sale price of $17,000,000. In the commercial real estate industry, it is common to say that this property sold at a 5.8% cap rate.

Intuition Behind the Cap Rate

What is the cap rate actually telling you?  One way to think about the cap rate intuitively is that it represents the percentage return an investor would receive on an all cash purchase.  In the above example, assuming the real estate proforma is accurate, an all cash investment of $17,000,000 would produce an annual return on investment of 5.8%. Another way to think about the cap rate is that it’s just the inverse of the price/earnings multiple.  Consider the following chart:

cap_rate_multiple

As shown above, cap rates and price/earnings multiples are inversely related.  In other words, as the cap rate goes up, the valuation multiple goes down.

When, and When Not, to Use a Cap Rate

The cap rate is a very common and useful ratio in the commercial real estate industry and it can be helpful in several scenarios.  For example, it can and often is used to quickly size up an acquisition relative to other potential investment properties.  A 5% cap rate acquisition versus a 10% cap rate acquisition for a similar property in a similar location should immediately tell you that one property has a higher risk premium than the other.

Another way cap rates can be helpful is when they form a trend.  If you’re looking at cap rate trends over the past few years in a particular sub-market then the trend can give you an indication of where that market is headed.  For instance, if cap rates are compressing that means values are being bid up and a market is heating up. Where are values likely to go next year?  Looking at historical cap rate data can quickly give you insight into the direction of valuations.

While cap rates are useful for quick back of the envelope calculations, it is important to note when cap rates should not be used. When properly applied to a stabilized Net Operating Income (NOI) projection, the simple cap rate can produce a valuation approximately equal to what could be generated using a more complex discounted cash flow (DCF) analysis. However, if the property’s net operating income stream is complex and irregular, with substantial variations in cash flow, only a full discounted cash flow analysis will yield a credible and reliable valuation.

Components of the Cap Rate

What are the components of the cap rate and how can they be determined?  One way to think about the cap rate is that it’s a function of the risk free rate of return plus some risk premium.  In finance, the risk free rate is the theoretical rate of return of an investment with no risk of financial loss.  Of course in practice all investments carry even a small amount of risk. However, because U.S. bonds are considered to be very safe, the interest rate on a U.S. treasury bond is normally used as the risk-free rate. How can we use this concept to determine cap rates?

Suppose you have $10,000,000 to invest and 10-year treasury bonds are yielding 3% annually. This means you could invest all $10,000,000 into treasuries, considered a very safe investment, and spend your days at the beach collecting checks. What if you were presented with an opportunity to sell your treasuries and instead invest in a Class A office building with multiple tenants? A quick way to evaluate this potential investment property relative to your safe treasury investment is to compare the cap rate to the yield on the treasury bonds.

Suppose the acquisition cap rate on the investment property was 5%.  This means that the risk premium over the risk free rate is 2%.  This 2% risk premium reflects all of the additional risk you assume over and above the risk free treasuries, which takes into account factors such as:

  • Age of the property.
  • Credit worthiness of the tenants.
  • Diversity of the tenants.
  • Length of tenant leases in place.
  • Broader supply and demand fundamentals in the market for this particular asset class.
  • Underlying economic fundamentals of the region including population growth, employment growth, and inventory of comparable space on the market.

When you take all of these items and break them out, it’s easy to see their relationship to the risk free rate and the overall cap rate. It’s important to note that the actual percentages of each risk factor of a cap rate and ultimately the cap rate itself are subjective and depend on your own business judgement and experience.

Is cashing in your treasuries and investing in an office building at a 5% acquisition cap rate a good decision?  This of course depends on how risk averse you are.  An extra 2% yield on your investment may or may not be worth the additional risk inherent in the property. Perhaps you are able to secure favorable financing terms and using this leverage you could increase your return from 5% to 8%.  If you a more aggressive investor this might be appealing to you.  On the other hand, you might want the safety and security that treasuries provide, and a 3% yield is adequate compensation in exchange for this downside protection.

Band of Investment Method

The above risk free rate approach is not the only way to think about cap rates.  Another popular alternative approach to calculating the cap rate is to use the band of investment method.  This approach takes into account the return to both the lender and the equity investors in a deal. The band of investment formula is simply a weighted average of the return on debt and the required return on equity.  For example, suppose we can secure a loan at an  80% Loan to Value (LTV), amortized over 20 years at 6%.  This results in a mortgage constant of 0.0859.  Further suppose that the required return on equity is 15%.  This would result in a weighted average cap rate calculation of 9.87% (80%*8.59% + 20%*15%).

The Gordon Model

One other approach to calculating the cap rate worth mentioning is the Gordon Model. If you expect NOI to grow each year at some constant rate, then the Gordon Model can turn this constantly growing stream of cash flows into a simple cap rate approximation.  The Gordon Model is a concept traditionally used in finance to value a stock with dividend growth:

gordon_model_cap_rate

This formula solves for Value, given cash flow (CF), the discount rate (k), and a constant growth rate (g).  From the definition of the cap rate we know that Value = NOI/Cap. This means that the cap rate can be broken down into two components, k-g.  That is, the cap rate is simply the discount rate minus the growth rate.

How can we use this? Suppose we are looking at a building with an NOI of $100,000 and in our analysis we expect that the NOI will increase by 1% annually.  How can we determine the appropriate cap rate to use?  Using the Gordon Model, we can simply take our discount rate and subtract out the annual growth rate.  If our discount rate (usually the investor’s required rate of return) is 10%, then the appropriate cap rate to use in this example would be 9%, resulting in a valuation of $1,111,111.

The Gordon Model is a useful concept to know when evaluating properties with growing cash flows.  However, it’s not a one-size fits all solution and has several built in limitations.  For example, what if the growth rate equals the discount rate?  This would yield an infinite value, which of course in nonsensical. Alternatively, when the growth rate exceeds the discount rate, then the Gordon Model yields a negative valuation which is also a nonsensical result.

These built-in limitations don’t render the Gordon Model useless, but you do need to be aware of them.  Always make sure you understand the assumptions you are making in an analysis and whether they are reasonable or not.

The Many Layers of Valuation

Commercial real estate valuation is a multi-layered process and usually begins with simpler tools than the discounted cash flow analysis. The cap rate is one of these simpler tools that should be in your toolkit.  The cap rate can communicate a lot about a property quickly, but can also leave out many important factors in a valuation, most notably the impact of irregular cash flows.

The solution is to create a multi-period cash flow projection that takes into account these changes in cash flow, and ultimately run a discounted cash flow analysis to arrive at a more accurate valuation.

“Explore Dream Discover……..”

Forbes
 
John Greathouse, Contributor 1/28/2014 @ 12:03PMn

If you want to live a personal and professional life with no regrets, follow these 43 life lessons, penned by H. Jackson Brown.

In the Fall of 1990, Mr. Brown sat at his kitchen table, pulled out a pad of paper and began writing advice to his son, who had just entered college. Mr. Brown’s aphorisms eventually evolve into twenty one books, including four New York Times bestsellers. With Life’s Little Instruction Book, Mr. Brown became the first author to simultaneously hold the number one positions on both of the NYT’s hardback and paperback lists.

Some of Mr. Brown’s quotes have become so well known that they are often mis-attributed to historical figures, including the following, which is widely credited to Mark Twain: “Twenty years from now you will be more disappointed by the things you didn’t do than by the ones you did do. So throw off the bowlines. Sail away from the safe harbor. Catch the trade winds in your sails. Explore. Dream. Discover.”


I came across a special edition of Mr. Brown’s Life’s Little Instruction Book (Volumes I – III) while waiting in line at a FedEx store. I almost never make impulse purchases, but after flipping through a few pages, the following paraphrased quote jumped off the page: “Live your life so that your epitaph boldly states, ‘No regrets.’” I promptly purchased the book as a Christmas gift for my teenage son.

As James Clear notes in The #1 Regret Of Dying Patients, far too many people spend their final stage of life regretting their youthful choices. Mr. Brown’s advice will help you to, “live a good, honorable life which you can enjoy a second time when you are old.”

When read nearly twenty-five years after they were penned, some of Mr. Brown’s musing are anachronisms (e.g., “Don’t sit while ladies are standing”), while others are banal (“Turn off the tap when brushing your teeth”). However, the vast majority of the 1,560 quotations in Volumes I – III of Life’s Little Instruction Book, are clever, relevant and inspirational.

Below are 43 quotes in bold text which are relevant to business executives who want to live a regret-free life. I categorized the quotes by: aspiration, kindness, leadership, success and happiness. In a few instances, I have slightly paraphrased Mr. Brown’s original text – my apologies to Mr. Brown and his purist fans. My brief annotations follow each quote.

Aspire

1. Never give up when you truly believe. The person with big dreams is more powerful than the one with all the facts – the smartest person in the room seldom beats the one with the most passion.

2. Believe in love at first sight – be open to instant infatuation with respect to both people and business ideas.

3. Never laugh at anyone’s dreams – no one has the right to opine upon someone else’s desired future because no one can attest to the validity of an unrealized dream.

4. Find a job you like and you add five days to every week – I often tell my children), “I never worked at day at my startups because we were having too much fun.” Admittedly, not every day was a carnival, but I certainly enjoyed the majority of my startup workdays.

5. Every so often, let your spirit of adventure triumph over your good sense – good judgment arises from mistakes, mistakes arise from bad judgment. Thus, a bit of occasional bad judgment is good for you.

6. Great love and great achievements involve great risk – nothing ventured, nothing gained. Go venture.

7. Never let the odds keep you from pursuing what you know in your heart you were meant to do – entrepreneurs never calculate probabilities, even if the chances are one in a million, “one” is all you need to win.